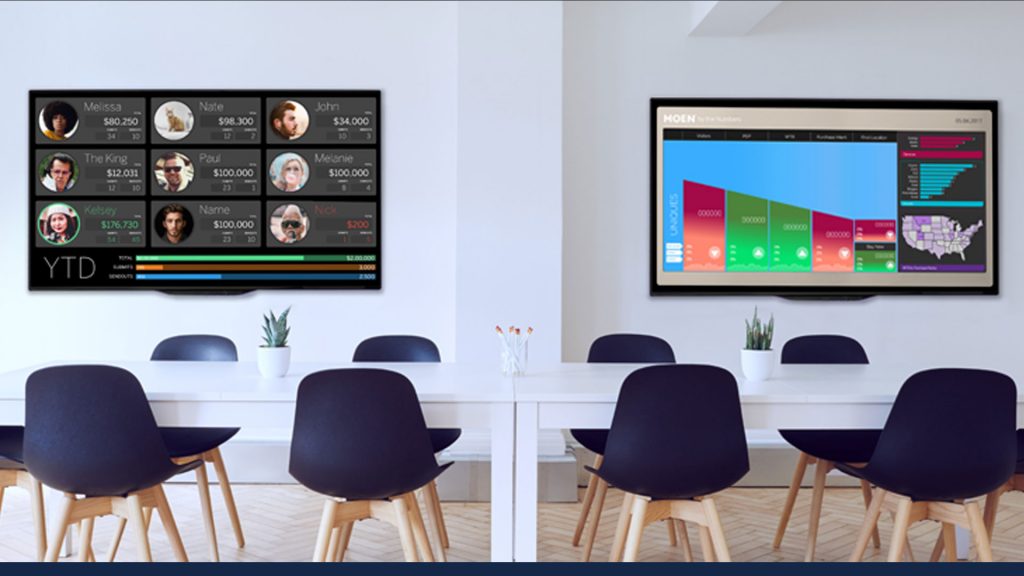
Displaying your data on a beautiful big screen TV can be a daunting task, but it doesn’t have to be. Here are some simple steps you can take to ensure an effective experience.

1. Your TV Needs a Browser
It doesn’t matter if your TV is a smart TV or not. Your TV has to have a browser. Amazon Fire has Silk browser, Roku has POPRISM , and Chromecast (casts the Google Chrome browser) all offer browser options that you can use to accomplish your goal. We prefer using Google Chromecast because it’s integrated into the Chrome browser and makes broadcasting to multiple TV’s a snap. If you’re really desperate, you can even use a USB stick to plug into the back of most TV’s. It works, but your data is only refreshed when you remove the USB, update the file, and plug it back in.
2. Know your Data needs
To create a successful digital signage experience, you really need to understand your data. Ask yourself the following questions:
- What Data Changes? How often does the Dimensions and Measures of your data change? (i.e. metrics, personnel, items you sell, or top performers)
- What is the frequency need of your data? In other words, how often does the data need to be refreshed? Everybody likes the sound of real-time data, but this can also be a distraction. Most companies do not actually benefit from having real-time data, so we recommend 15-minute refreshes unless there is a direct business case for real time.
- What data do I need to display? If your data isn’t actionable, you need to ask yourself why you are displaying the data in the first place. Data that’s displayed on a TV needs to be limited, so it can tell the viewers a clear story in seconds. In building your data story, think about the simplest way to tell it instead of cramming every data point possible onto the screen.
3. The Right Tool
If you’re displaying data you will need a BI tool such as Power BI or Tableau to name a few. We recommend Tableau because of its flexibility and advanced features. Power BI’s price point will tempt you but its framework will limit what you can achieve when building an effective experience. Also, keep in mind that you don’t have to buy either one of these tools. You can have professionals (like us of course) build the dashboards for you, which will be a more inexpensive option than the time and energy you would invest in trying to pull this off yourself.
4. Designing Your Dashboard
This is the biggest step that most people overlook. You need to design a dashboard that effectively tells the data story to the people passing by. If your TV is in an elevator bank or in a hallway, you only have 15 to 30 seconds of the viewer’s attention. Make sure your experience is as effective as possible by applying UI and UX design standards to your dashboard. Clarity is key in this step. If you have presented all the data, but your audience leaves confused or disinterested, this step may need to be revisited.
Ready, Set, GO!
IF you already have a dashboard built here are the steps to put your data on a TV using Chromecast.
- Launch Google Chrome
- Click the customize button on the top far right of the browser
- Select “Setting”
- Select “Manage other people”
- If it’s your first time, create one new person (what you name them is important as you just need one person per Chromecast)
- Click a person and cast to one Chromecast
- Repeat steps 2-6 until you have a person for every Chromecast you wish to cast to.
- Enter the URL of the dashboard
- Under view, select “Enter FullScreen” for each window.
- Click command-tab, alt-tab to change screens
- If the display on the TV is off, adjust the screen size of the TV (Wide, Standard, Normal, Ect.)
- if you have any roadblocks with your project, advanced features or someone to build your dashboard, contact us at. info@lisaboulderinsight.wpcomstaging.com
Good luck, -kev
