Tableau Training
Our Tableau certified consultants teach courses for any level of experience.
Tableau Training - at a fraction of the cost!
- Custom Curricula & Expert Trainers: Tailored for Tableau Creators, Explorers, and Viewers alike, our Certified Tableau Consultants offer custom content backed by real-world experience to suit every level of expertise. This ensures a targeted, insightful training experience that maximizes practical application.
- Consulting Expertise: Draw upon our decades of experience across various industries, with each course infused with best practices and actionable insights.
- Exclusive Access: Enroll in any course and gain access to the Boulder Insight Academy. Here, you’ll find all the materials you need—workbooks, videos, PDFs, and more—plus recordings of our training sessions to ensure mastery over time.
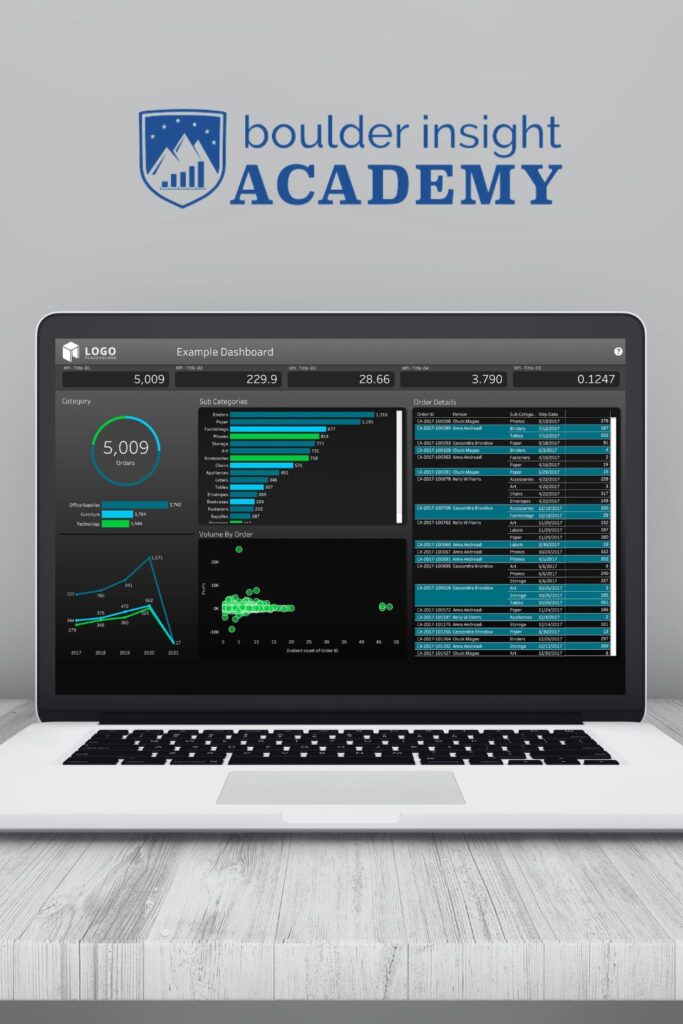
- Tableau Templates™: Accelerate your dashboard creation with our exclusive Tableau Templates™, included in your registration for an enhanced learning experience.
Group Training Courses
Tableau Viewer: The Basics
Getting started with Tableau
What is Tableau and why should I care about it? Everyone is raving about Tableau, but you’re not even sure how to use these new fancy dashboards. In this course we’ll show you how to access and navigate dashboards and get answers to questions that matter most to you.
Lesson 1 – Logging into Tableau Server and Finding Your Dashboards
Lesson 2 – How to interact with Dashboards
Lesson 3 – Getting Answers to the Your Questions using Ask Data
Lesson 4 – Saving Views

Tableau Explorer: Fundamentals
Building Your Core Skills
Tableau is more than just “Pretty Excel,” it’s a super powerful tool that can allow you to better see and understand your data. In this course, we’ll help you build your core skills and confidence in using Tableau so you can make meaningful data visualizations that allow you and your teams to make data-driven decisions.
Lesson 1: Getting Started in Tableau
Lesson 2: Connecting to Published Data Sources + Using Ask Data
Lesson 3: Building Charts with More than One Measure
Lesson 4: What day is it? Working with Dates in Tableau
Lesson 5: Maps, Filters and Sorting
Lesson 6: Groups and Hierarchies
Lesson 7: Introduction to Calculated Fields
Lesson 8: Understanding Quick Table Calculations
Lesson 9: Reference Lines and Showing Breakdowns of the Whole
Lesson 10: Dashboarding Basics
Lesson 11: Creating an Interactive Dashboard
Lesson 12: Dashboard Design Best PracticesYou’ve got Tableau installed on your computer, now what?

Tableau Creator: Fundamentals
Building Your Core Skills
You’ve got Tableau installed on your computer, now what? Tableau is more than just “Pretty Excel,” it’s a super powerful tool that can allow you to better see and understand your data. In this course we’ll help you build your core skills and confidence in using Tableau so you can make meaningful data visualizations that allow you and your teams to make data-driven decisions.
Lesson 1: Getting Started in Tableau
Lesson 2: Connecting to Data
Lesson 3: Building Charts with More than One Measure
Lesson 4: What day is it? Working with Dates in Tableau
Lesson 5: Maps, Filters and Sorting
Lesson 6: Groups and Hierarchies
Lesson 7: Introduction to Calculated Fields
Lesson 8: Understanding Quick Table Calculations
Lesson 9: Reference Lines and Showing Breakdowns of the Whole
Lesson 10: Dashboarding Basics
Lesson 11: Creating an Interactive Dashboard
Lesson 12: Dashboard Design Best Practices

Tableau Creator: Intermediate
Taking Tableau to the next level
You’ve got some Tableau skills, now let’s take them to the next level! In our intermediate class, the learning continues, with deep dives into chart types, all types of calculations, cool features to give your end-users control, and some advanced dashboard best practices. You’ll be able to “Ta-Blow” some minds with your new skills, impressing your peers and boss alike.
Lesson 1: Review of Key Concepts
Lesson 2: Intermediate Chart Types + When to Use Them – Part 1
Lesson 3: Intermediate Chart Types + When to Use Them – Part 2
Lesson 4: Leveraging the Analytics Pane
Lesson 5: Exploring Your Data – Building a Data Discovery Workbook
Lesson 6: Data Connection Options – Part 1 – Relationships + Joins
Lesson 7: Data Connection Options – Part 2 – Blends + Unions
Lesson 8: Deep Dive – Calculated Fields – Part 1 – More Advanced Calculated Fields
Lesson 9: Deep Dive – Calculated Fields – Part 2 – Level Of Detail Calculations (LODs)
Lesson 10: Deep Dive – Intermediate Table Calculations
Lesson 11: Using Parameters
Lesson 12: Putting it All Together: Intermediate Dashboards Actions + Dashboard Design Best Practices

Tableau Creator: The BIG (Boulder Insight Group) Way
Mastering Tableau
We’ve been doing this Data Viz stuff for over a decade and have learned a lot of lessons – some of them the hard way. In this course, you’ll get to work with and learn from several of our team members as they share their super powers and best tips and tricks to make your dashboards shine and wow your teams with your new Tableau mastery.
Lesson 1: The Visual Analysis Process + Memory & Processing
Lesson 2: Which Charts to Use When – Advanced Chart Types
Lesson 3: Human-Centered Design Principles
Lesson 4: UI/UX (User Interface/User Experience) Design Best Practices
Lesson 5: Naming Conventions for Calculations Best Practices
Lesson 6: Deep Dive – Advanced Parameters and Calculations
Lesson 7: Deep Dive – Advanced Table Calculations
Lesson 8: QA (Quality Assurance): Is My Data Correct? QA Sheets and How to Use Them
Lesson 9: QA: Formatting – Dotting your “i’s” and Crossing your “t’s”
Lesson 10: Putting it All Together – Part 1 – Anatomy of a Dashboard + Building an Index Page
Lesson 11: Putting it All Together – Part 2 – Advanced Dashboards Actions + Dashboard Design Best Practices
Tableau Creator: Data Visualization Design
Data Visualization Design and Methodologies
With more than a decade of design experience we’ve learned some incredible insights around creating visualizations that are a perfect combination of stunning, intuitive, and informative. By incorporating ‘Human-Centered Design Methodologies’ you too will create more compelling analysis.
Lesson 1: The Visual Analysis Process + Memory & Processing
Lesson 2: Which Charts to Use When – Advanced Chart Types
Lesson 3: Human-Centered Design Principles
Lesson 4: UI/UX (User Interface/User Experience) Design Best Practices

Tableau Creator: Best Practices
Mastering Tableau: From Naming Conventions to Advanced Calculations and Parameters
Going a bit more in-depth after completing our Tableau Intermediate class. This abbreviated class provides insights as to naming conventions, parameters, and calculations. This class helps experienced Tableau user take their work to the next level.
Lesson 1: Naming Conventions for Calculations Best Practices
Lesson 2: Deep Dive – Advanced Parameters and Calculations
Lesson 3: Deep Dive – Advanced Table Calculations
Lesson 4: QA (Quality Assurance): Is My Data Correct? QA Sheets and How to Use Them Concept 9: QA: Formatting – Dotting your “i’s” and Crossing your “t’s”
Lesson 5: Putting it All Together – Part 1 – Anatomy of a Dashboard + Building an Index Page
Lesson 6: Putting it All Together – Part 2 – Advanced Dashboards Actions + Dashboard Design Best Practices
Tableau Creator: Intensive (Fundamental + Intermediate)
Building your core skills and taking them to the next level (accelerated)
Elevate your Tableau expertise from the fundamentals to the intermediate level with our combined Tableau Fundamentals and Intermediate course. This combined offering seamlessly bridges the gap between understanding the basics and mastering the intricacies of Tableau.
Work with our team to decide the best combination (20 hours) of the following modules:
– Getting Started in Tableau
– Connecting to Data
– Building Charts with More than One Measure
– What day is it? Working with Dates in Tableau
– Maps, Filters and Sorting
– Groups and Hierarchies
– Introduction to Calculated Fields
– Understanding Quick Table Calculations
– Reference Lines and Showing Breakdowns of the Whole
– Dashboarding Basics
– Review of Key Concepts
– Intermediate Chart Types + When to Use Them – Part 1
– Intermediate Chart Types + When to Use Them – Part 2
– Leveraging the Analytics Pane
– Exploring Your Data – Building a Data Discovery Workbook
– Data Connection Options – Part 1 – Relationships + Joins
– Data Connection Options – Part 2 – Blends + Unions
– Deep Dive – Calculated Fields – Part 1 – More Advanced Calculated Fields
– Deep Dive – Calculated Fields – Part 2 – Level Of Detail Calculations (LODs)
– Deep Dive – Intermediate Table Calculations
– Using Parameters
Group Training Pricing
Standard Boulder Insight Curriculum
For our maximum class size of 15 people each course is $9K. This is inclusive of comprehensive materials, preparation, and follow-up.
Our training materials and curriculum have been honed over more than a decade and the small size of our courses ensures optimal instructor-student interaction.
Recommended: Custom Curriculum - Client Data
Looking to customize your training and leverage your actual data so that your team can build the most relevant dashboards and insights with your data? We can do that! The skills we teach are the same, however, learning how to utilize Tableau and learning how to think about and deploy data visualization tools is better when we’re leveraging data that is most familiar and the easiest to understand.
Not only apply your customized date sets but you can also work with our experienced trainers to adjust the curricula and modules you feel are most relevant to your company’s needs. Draw upon the best of Boulder Insight’s lesson plans and modules to ramp-up, refresh or sharpen your team’s skills to help grow your business to new heights.
Pricing is customized to each client, the complexity of their data, the class size, and number of classes. Please reach out to one of our Boulder Insight representatives to receive a competitive pricing proposal to meet your company’s needs. (Discounts are applied to returning customers and multi-service partnerships)
*Please Note: contract size and class size informs pricing.
Recommended Add-Ons
- Custom Tableau Templates creation with Dashboard Training Session
- Coaching/Mentoring Sessions – 1:1 or with small groups
Class Size
We recommend keeping class size to a maximum of 15 students for optimal instructor-student interaction.
FAQs
We provide a series of Tableau training courses throughout 2024, available for anyone to register. These sessions are delivered virtually via Zoom by a certified Tableau Trainer, offering in-depth and interactive Tableau education. We provide virtual, instructor-led courses through Boulder Insight Academy that are public and open for registration for beginner to advanced level users. We also provide private courses which can be tailored to your organization’s specific needs. These private courses can be taught virtually or in person.
Our virtual Tableau classes are hosted live on Zoom, enabling direct interaction with the trainer. Participants benefit from real-time guidance, practical exercises, and immediate answers to their queries, enhancing the learning experience.
Our courses are led by certified Tableau Trainers, who are seasoned professionals in the field. Their expertise ensures you gain valuable, practical knowledge and skills in Tableau.
Yes, we provide a 50% discount for students with valid proof of current enrollment in an educational institution. This offer is designed to make our training more accessible to students looking to enhance their Tableau skills.
To maintain a high-quality learning environment, we limit our public class sizes to 15 participants. This approach ensures each attendee receives ample attention and support throughout the course.
For groups larger than five, we recommend arranging a private training course with us. This allows for a tailored training experience that can better address the specific needs and goals of a larger team. It is also more cost effective to have a private course than to register for the public courses when you reach larger numbers.
Tovuti LMS powers our Boulder Insight Academy LMS Portal, offering an engaging and intuitive platform for course materials and progress tracking. This integration provides a rich learning experience, where participants have all the tools and resources they need at their fingertips. Easy access to recorded sessions and curriculum-specific content fosters an immersive educational environment, tailored to meet diverse learning needs and boost engagement.
Individuals can enroll in our scheduled classes directly through our website. For group training, or to arrange a session for more than five participants, please contact us to set up a bespoke training program by sending an email to training@boulderinsight.com
Absolutely, our commitment to your success extends beyond course completion. We understand the importance of ongoing support as you apply your new Tableau skills in the real world. To this end, we offer several layers of post-training assistance:
- Tableau LIVE!: Join us for our monthly Tableau LIVE! sessions at no cost. These sessions are a great way to stay connected, ask questions, and explore new features in Tableau.
- Coaching/Mentoring: For those working on short-term projects and needing specific guidance, we offer coaching and mentoring with our team of Tableau experts. This targeted support is designed to help you navigate challenges and apply your skills effectively.
- FTE (Fractional Topic Expert) Retainer: For larger projects or ongoing support needs, our FTE Retainer model allows you to have the right person, with the right skills, when you need them. This model provides dedicated, expert assistance tailored to your project’s scale and complexity.
Our goal is to provide you with the support you need, whatever that looks like, to be successful in utilizing Tableau for your data visualization projects.